The hammer and shooting star are opposites — and two of the most reliable single-candle reversal patterns.
The hammer and shooting star are opposites — and two of the most reliable single-candle reversal patterns.
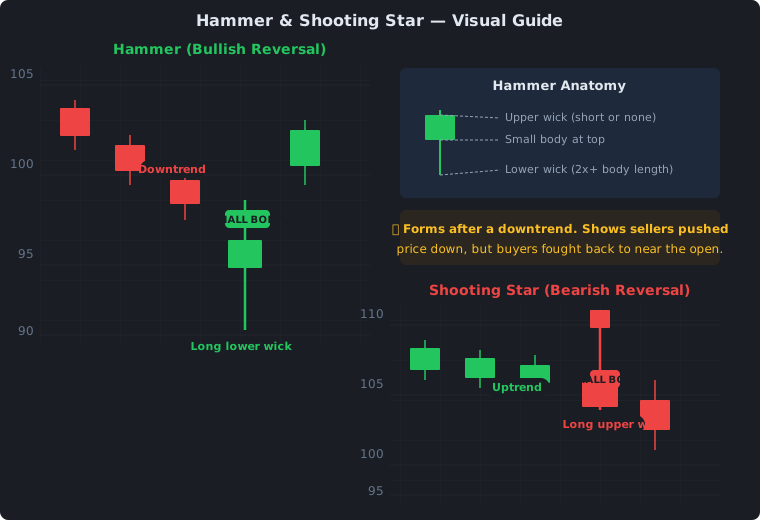
Both have the same shape (small body, one long wick), but they appear in different contexts with opposite meanings.
What Are They?
| Pattern | Context | Meaning |
|---|---|---|
| Hammer | After a downtrend | Bullish reversal — sellers pushed price down but buyers fought back |
| Shooting Star | After an uptrend | Bearish reversal — buyers pushed price up but sellers rejected it |
Both patterns have a small body at one end and a wick at least 2x the body length on the other end.
How to Identify a Hammer
The hammer forms at the bottom of a downtrend:
- Small body at the top of the candle’s range
- Long lower wick (2x or more the body height)
- Little or no upper wick
- Candle can be green or red — green is slightly more bullish
The long lower wick means sellers pushed price down hard, but buyers stepped in and pushed it back up to near the open. That is the story: sellers tried, failed, and buyers took control.
How to Identify a Shooting Star
The shooting star forms at the top of an uptrend:
- Small body at the bottom of the candle’s range
- Long upper wick (2x or more the body height)
- Little or no lower wick
- Candle can be green or red — red is slightly more bearish
The long upper wick means buyers pushed price up, but sellers rejected those levels and pushed it back down. Buyers tried to continue the uptrend, but they ran out of steam.
What They Tell You
| Hammer | Shooting Star | |
|---|---|---|
| Where it forms | After a downtrend | After an uptrend |
| Long wick direction | Down (rejection of lows) | Up (rejection of highs) |
| Market message | Buyers are stepping in | Sellers are stepping in |
| Body color preference | Green (stronger) | Red (stronger) |
| Signal type | Bullish reversal | Bearish reversal |
How to Trade Them
Rule 1: Wait for Confirmation
Never trade on the hammer or shooting star alone. Wait for the next candle:
| Pattern | Confirmation |
|---|---|
| Hammer | Next candle closes green (above hammer’s close) |
| Shooting star | Next candle closes red (below shooting star’s close) |
Rule 2: Check the Context
The pattern is strongest when it forms at:
- A support level (hammer) or resistance level (shooting star)
- An oversold RSI (hammer) or overbought RSI (shooting star)
- After a trend that has been running for several sessions
Rule 3: Entry & Stop Strategy
| Hammer | Shooting Star | |
|---|---|---|
| Entry | At close of confirmation candle | At close of confirmation candle |
| Stop loss | Below the hammer’s low | Above the shooting star’s high |
| Take profit | Next resistance level | Next support level |
| Volume filter | Prefer higher volume on hammer than prior candles | Same |
How They Can Fail
| Failure Reason | Hammer | Shooting Star |
|---|---|---|
| Wick too short | Rejection was weak, not meaningful | Same |
| No confirmation | Next candle doesn’t follow through | Same |
| Low volume | Lack of institutional participation | Same |
| Stronger trend | Daily downtrend overrides 4H hammer | Daily uptrend overrides 4H star |
Hammer vs. Doji: What’s the Difference?
A dragonfly doji looks similar to a hammer (long lower wick) but has no body — open and close are identical. A hammer has a small but real body. The hammer is generally considered a stronger signal because it shows actual buying (a close above the open).
Practice Exercise
Open a daily chart of your favorite asset. Scan for:
- A clear downtrend ending with a hammer — did price reverse after?
- A clear uptrend ending with a shooting star — did price drop after?
- Note the wick-to-body ratio. Compare signals where the wick was 2x versus 3x the body.
The reversal cheat sheet
| Pattern | Context | Meaning |
|---|---|---|
| Hammer | After a downtrend | Bullish reversal — buyers rejected the low |
| Shooting star | After an uptrend | Bearish reversal — sellers rejected the high |
| Wick rule | Both | Wick must be at least 2x the body |
| Confirmation | Both | Always wait for the next candle to confirm |
What to avoid
The most common mistake traders make with these patterns is treating a bare candle as a signal in its own right. A hammer with no confirmation, no support context, and weak volume is frequently just the midpoint of a continued decline rather than a turning point. The same applies to a shooting star that appears mid-push in a strong, healthy uptrend — without overbought conditions or a resistance level, it often means little.
A second error is insisting on a green or red body when it is not essential. While a green hammer or a red shooting star is marginally stronger, the color is secondary to the wick length and the context; demanding a perfect candle leads traders to skip perfectly valid setups. The related mistake is ignoring how strong the underlying trend is. A daily downtrend can easily override a 4-hour hammer, so it is wise to make sure the pattern is not fighting a much larger move.
Finally, traders often place their stop too close to the body rather than below the wick. The entire point of the hammer is that the low was rejected, so the stop belongs below that low — and for a shooting star, above the high. Setting tighter stops to save a few ticks leads to getting stopped out by normal wick noise right before the pattern plays out.
Practising the read
The fastest way to internalise these patterns is to study them on daily charts rather than reading about them. Open a daily chart of any liquid asset and scroll back through several months, looking for clear downtrends ending in a hammer and clear uptrends ending in a shooting star. For each one, note whether price actually reversed afterwards, and compare the signals where the wick was 2x the body versus 3x. Over time this builds an honest sense of how often these candles deliver in practice, which no number of articles can replace.
As you build that evidence, remember that the patterns are probabilities, not certainties. They hand you a defined setup with a clear stop and a clear take-profit target, but they do not guarantee which way the market resolves. That is exactly why the confirmation candle and the risk-managed stop matter so much — they turn an uncertain single candle into a bounded, testable trade.
Keeping them in perspective
Hammer and shooting star candles are best treated as a starting filter within a broader technical toolkit rather than as a standalone system. Their strongest value shows up when they coincide with support or resistance, an overbought or oversold RSI, and a location at the end of a trend that has been running for several sessions. Used that way, they give you a high-probability place to look for a turn — and combined with sensible position sizing and a disciplined stop, they become a reliable part of a larger approach.
They also fit naturally alongside the other candlestick patterns, since single-candle reversals complement the two-candle and multi-candle formations taught across the technical-analysis material. The key is consistency: define your rules for the wick ratio, the confirmation, and the stop in advance, apply them every time, and let a sample of dozens of trades tell you how well the pattern is working for your market and timeframe.