A doji forms when a candle’s open and close are nearly identical — buyers and sellers fought to a draw.
On its own, a doji means nothing. But when it appears after a strong trend, it can signal that the trend is losing steam and a reversal is coming.
What Is a Doji?
The doji is a single-candle pattern. The body is very small or nonexistent because the open and close prices are almost the same. The wicks (shadows) can be short or long depending on the type.
The name comes from a Japanese term meaning “same” or “mistake” — a reference to the open and close being at the same level.
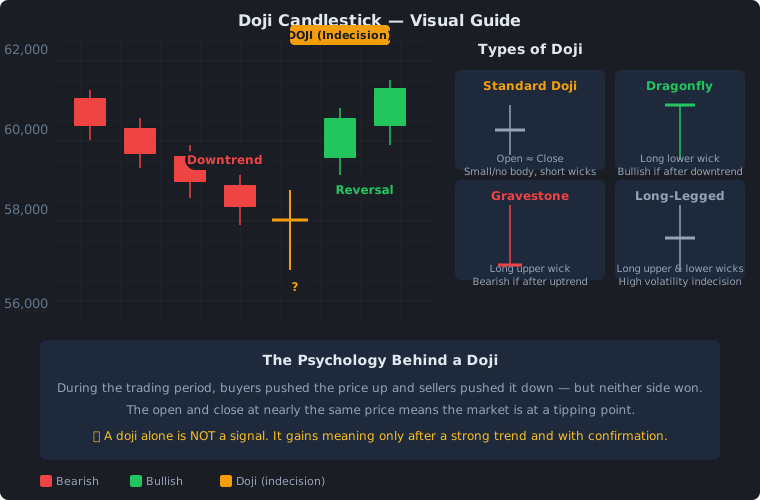
The Four Types of Doji
| Type | Appearance | What It Means |
|---|---|---|
| Standard Doji | Small body, short wicks both sides | General indecision, market pausing |
| Dragonfly Doji | Long lower wick, little or no upper wick | Buyers stepped in after a sell-off — bullish if after a downtrend |
| Gravestone Doji | Long upper wick, little or no lower wick | Sellers rejected higher prices — bearish if after an uptrend |
| Long-Legged Doji | Long wicks both sides | High volatility with no clear winner, major indecision |
The dragonfly and gravestone are the most significant because they show a clear rejection of price levels.
How to Identify a Doji
The key rules:
- The body must be very small — ideally no more than 5% of the candle’s full range
- The wicks can be any length, but the body stays tiny
- It must appear after a clear trend (uptrend or downtrend)
A doji in a sideways market is just noise. Ignore it.
What It Tells You
The psychology of a doji depends on where it appears:
| Context | Meaning |
|---|---|
| After a strong uptrend | Buyers are exhausted — sellers may take over |
| After a strong downtrend | Sellers are exhausted — buyers may step in |
| After a doji → bullish candle | Reversal confirmed, trend may turn up |
| After a doji → bearish candle | Reversal confirmed, trend may turn down |
The doji marks a potential turning point. You wait for the next candle to confirm the direction.
How to Trade It
Rule 1: Wait for Confirmation
Never trade a doji alone. Wait for the next candle:
- After a downtrend: Doji forms → next candle closes green → bullish signal
- After an uptrend: Doji forms → next candle closes red → bearish signal
Rule 2: Check the Context
The doji is strongest when it forms at:
- A support or resistance level
- A key moving average (50 EMA, 200 MA)
- An oversold or overbought RSI reading
Rule 3: Entry & Stop Strategy
| Approach | |
|---|---|
| Entry | Enter at the close of the confirmation candle |
| Stop loss | Below the doji’s low (for bullish) or above the doji’s high (for bearish) |
| Take profit | Next major support/resistance level, or 1.5x risk |
| Filter | Only trade if the confirmation candle has higher volume than the doji |
How It Can Fail
| Failure Reason | What to Watch |
|---|---|
| No trend before it | Doji in a range is meaningless |
| No confirmation next candle | If next candle is also indecisive, skip |
| Low volume | Without volume, the reversal lacks conviction |
| Stronger timeframe trend | Daily uptrend can override a 4H doji signal |
Practice Exercise
Open a daily BTC/USD chart on TradingView. Scroll through the last year and find:
- A clear downtrend followed by a dragonfly doji
- A clear uptrend followed by a gravestone doji
- Notice what happened in the next 3-5 candles each time
Count how often the doji led to a real reversal versus how often it was a false signal.
What to remember
| Key Point | Takeaway |
|---|---|
| What it is | A candle where open and close are nearly identical — market indecision |
| Why it matters | After a strong trend, it signals the trend is losing steam |
| The four types | Standard, dragonfly (bullish), gravestone (bearish), long-legged (high volatility) |
| Your edge | Always wait for the next candle to confirm before trading |
Where traders get it wrong
The most common failure with the doji is treating it as a tradeable signal in its own right. A trader sees a dragonfly at the bottom of a move and buys immediately, only to watch the next candle make a lower low. The doji never said “go long” — it said “the sellers have run out of obvious strength,” and that is a different and far weaker statement. Confirmation from the following candle is not a nice-to-have; it is the entire basis of the trade, and skipping it turns a reasonable setup into a guess.
Context matters every bit as much. A doji that appears in the middle of a sideways range is meaningless, because the market was already undecided and there is no trend for it to reverse. The same pattern after a clean multi-week downtrend or uptrend carries real information. Equally, a single doji on a low timeframe such as 1-minute is everywhere and tells you little, whereas the identical pattern on a daily chart after a sustained move is a genuine warning sign. Learning to filter for trend and timeframe is what makes the doji useful at all.
Building the habit of confirmation
If you want the doji to work for you consistently, build a small routine around it rather than treating it as a one-off guess. First, only look for dojis after a clear trend — uptrend or downtrend — because that is the only context in which they carry meaning. Second, note where the doji sits: at a support or resistance level, against a key moving average such as the 50 EMA or 200 MA, or alongside an oversold or overbought RSI reading. Third, and most importantly, refuse to act until the next candle confirms, and check that confirmation has higher volume than the doji itself.
This may feel slow, but the patience is the strategy. Most traders who fail with reversal patterns do so precisely because they act on the warning sign instead of the confirmation. By waiting for one extra candle, you throw out a large share of false signals while keeping the genuine reversals. The practice exercise in this article — finding historical dojis on a daily BTC/USD chart and measuring what happened in the following 3-5 candles — is the fastest way to build the reference set you need to trust this process.
Bottom line
The doji is one of the simplest candles on the chart and one of the most misunderstood. It does not predict a reversal on its own; it tells you that the current trend has lost its conviction and that a decision is coming. The four types — standard, dragonfly, gravestone, and long-legged — each carry a slightly different hint about which side is likely to prevail, but all of them require the next candle to confirm before they are worth acting on. Trade dojis only after a clear trend, only at a meaningful level, only with volume, and only after confirmation. Done that way, the doji becomes a reliable early warning instead of an excuse to gamble.