A single candlestick can tell you more about market sentiment than most indicators.
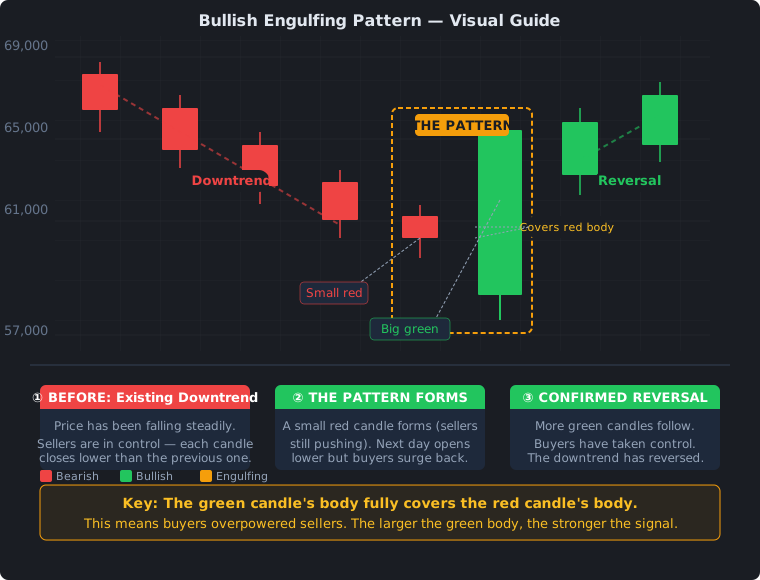
The bullish engulfing pattern is one of the most reliable reversal signals in technical analysis. It appears at the end of a downtrend and signals that buyers have overwhelmed sellers.
Here is exactly how it works, what to look for, and how to confirm it with other tools.
What Is a Bullish Engulfing Pattern?
Two candles form this pattern:
- A red (bearish) candle — sellers are in control, price closes lower
- A larger green (bullish) candle — opens below the previous close, then rallies to close above the previous open
The green candle’s body “engulfs” the red candle’s body completely.
How to Identify It
The pattern has three requirements:
| Requirement | Why It Matters |
|---|---|
| Prior downtrend | The pattern is meaningless in a sideways or uptrending market |
| Bearish candle first | Confirms sellers were in control |
| Bullish candle engulfs | The green candle’s body completely covers the red candle’s body |
The most powerful engulfing patterns have a small red candle followed by a much larger green candle — the larger the engulfing candle, the more aggressive the buying pressure.
What It Tells You
The psychology behind a bullish engulfing pattern:
| Phase | Sentiment |
|---|---|
| Before pattern | Bears are in control, price is making lower lows |
| Red candle forms | Sellers push price down, close near the low |
| Green candle opens | Price gaps down or opens lower — bears feel confident |
| Green candle rallies | Buyers step in aggressively, price reverses |
| Green candle closes | Closes above the red candle’s open — bulls have won |
| Follow-through | If next candle stays above the engulfing close, reversal is confirmed |
How to Trade It
A bullish engulfing alone is not enough. Here is how to filter for higher-probability trades:
1. Check the Context
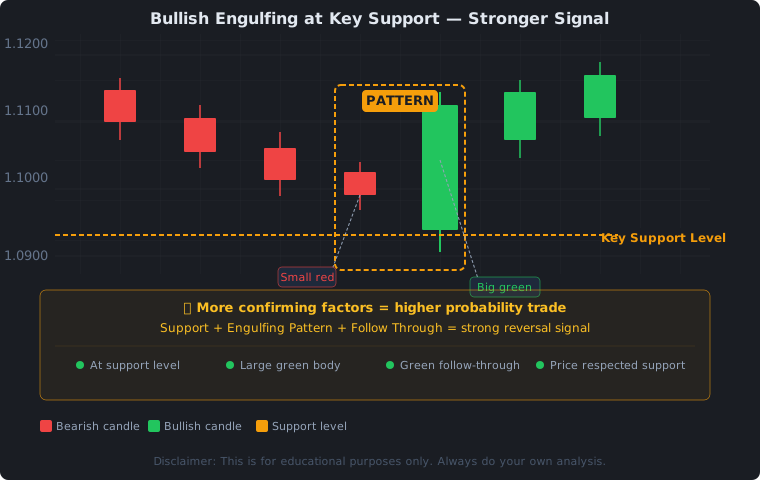
The pattern is strongest when it forms at:
- A known support level (previous swing low, trendline, moving average)
- A round number (60,000 BTC, 1.2000 EUR/USD)
- After a measured move down (price dropped 10-20%)
2. Confirm With Volume
Volume must be higher on the engulfing candle than the previous candles. The volume spike confirms that institutional money is behind the move.
3. Add a Momentum Indicator
A MACD crossover or RSI divergence at the same time significantly increases the probability.
4. Entry & Stop Strategy
| Approach | |
|---|---|
| Aggressive entry | Buy at the close of the engulfing candle |
| Conservative entry | Wait for a retest of the engulfing candle’s close |
| Stop loss | Below the engulfing candle’s low |
| Take profit | Previous swing high or 1.5x - 2x the risk |
Real Examples Across Markets
Crypto: Bitcoin 4H Chart
The pattern forms after a 4-5 candle decline to a known support zone. The engulfing candle closes above the 50 EMA, volume spikes 3x above average, and MACD crosses bullish. Price rallies 4% over the next 12 hours.
Forex: EUR/USD Daily
After a 3-day sell-off, a bullish engulfing forms right at a key horizontal support. RSI shows bullish divergence (price made lower low, RSI made higher low). Price reverses 150 pips over the following week.
Stocks: NVDA Weekly
During a pullback in a longer-term uptrend, a bullish engulfing on the weekly chart signals the correction is over. The pattern is more reliable on higher timeframes.
What Makes It Fail
| Failure Reason | What to Watch |
|---|---|
| Engulfing candle has small body | Weak buying pressure, likely to fail |
| Low volume on the engulf | No institutional participation |
| Stronger trend against you | Daily downtrend overpowers 4H signal |
| No follow-through next candle | If next candle closes below engulfing close, the signal is invalid |
Practice Exercise
Look at a BTC/USD 4H chart on TradingView. Scroll back and find examples where:
- Price made a clear downtrend
- A bullish engulfing formed
- Volume was higher than the previous 5 candles
- MACD crossed bullish at the same time
Mark how often price rallied at least 2-3% after. That is your edge.
What to remember
| Key Point | Takeaway |
|---|---|
| What it is | A two-candle reversal pattern where a green candle fully engulfs the previous red candle |
| Why it works | It shows a complete shift in control from sellers to buyers |
| When it’s strongest | At support, with high volume, and MACD/RSI confirmation |
| Your edge | Trade only when 3+ confluence factors align |
What makes a pattern fail
The most common reason a bullish engulfing gives a bad signal has nothing to do with the candlesticks themselves — it is that the trader ignored the surrounding context. A pattern that looks clean on the 4-hour chart is often meaningless if the daily trend is firmly against it, because a signal on a lower timeframe cannot easily overpower a move on a higher one. Conversely, a trader who sees one clean engulfing at support and jumps in without a stop can be caught out when the next candle reverses the whole move.
There are also mechanical tell-tales worth checking before you commit. If the engulfing candle has only a small body, the buying pressure behind it is weak and the signal is far more likely to fail. If volume is flat or lower than the candles before it, there is little evidence that institutional money is behind the move — and volume is the single strongest confirmation you have. Finally, if there is no follow-through on the next candle — meaning it closes back below the engulfing candle’s close — the signal has already been invalidated, and the disciplined move is to stand aside rather than hope.
Treat these checks as a pre-trade checklist rather than optional extras. A pattern that fails all four filters is not a signal at all; it is a coincidence. Waiting for the confluence of context, volume, and momentum confirmation is what separates a deliberate reversal trade from a coin flip.
Combining the pattern with your plan
A bullish engulfing is best treated as one input into a wider plan rather than a trigger to act on its own. Before the pattern even forms, decide where your stop loss will sit — below the engulfing candle’s low is the standard choice — and where you would reasonably take profit, such as the previous swing high or 1.5x to 2x your risk. Knowing both in advance removes the guesswork in the heat of the moment and makes it easy to size the position correctly.
It also helps to be honest about which assets and timeframes you trade well. A trader who lives on 1-minute charts will see countless engulfing candles that mean nothing, whereas the same individual focusing on daily charts and a handful of liquid markets will see far fewer but far more meaningful ones. If you are new to the pattern, the practice exercise earlier — finding historical examples on a BTC/USD 4H chart and measuring how often price rallied 2-3% after — is the fastest way to calibrate your own edge. The bigger your body of reviewed examples, the more you trust the signal when it genuinely appears.
Bottom line
The bullish engulfing is one of the best-known reversal signals because it visually captures a complete shift in control: sellers had the market, then a single large green candle took it back. That clarity is its strength, but it is also its weakness, because a visually perfect pattern can still fail when the context is wrong. Trade it at support, confirm it with volume and a momentum indicator, respect the higher timeframe, and always use a stop loss. Done that way, it becomes a reliable piece of a professional setup rather than a beginner’s guess.